Voyage Info
Voyage Dates
May 31 – June 2: Voyage mobilization *
June 3 – June 4: Onboard pre-voyage medical clearance *
June 5 – June 18: Voyage *
June 19: Voyage demobilization
*Covid-19 protocols could affect the dates of pre-voyage medical and isolation rules. We will continue to communicate changes in this landscape as they develop.
The International Nutrient Inter-comparison Voyage (INIV) will take place on board RV Investigator. The voyage will be departing from and returning to Hobart, Tasmania. RV Investigator is funded and managed by the Marine National Facility (MNF).There is a number of laboratory facilities on board RV Investigator. The INIV project will make use of both the Wet Clean and Dry Clean laboratory for participants coming on board. Ultra-pure MilliQ water and fume cupboard facilities are available in both laboratories. RV Investigator also has the facility to accommodate shipping container laboratories, both on the aft main deck and on level 2.
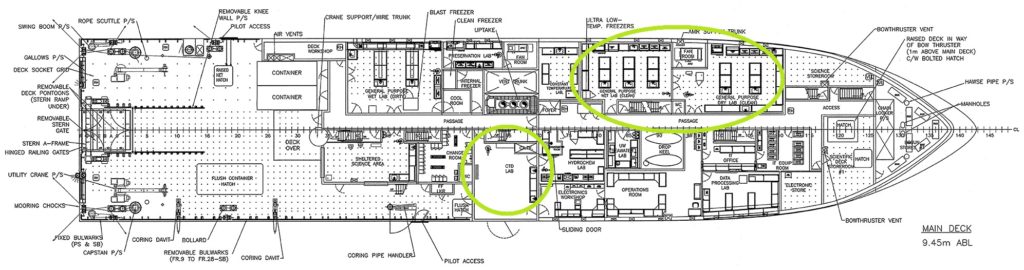 The main deck plan for RV Investigator. The majority of laboratories and scientific work spaces are on this deck. Circled in green are the laboratories INIV will plan to use, also circled is the CTD laboratory where deployment water samples are collected.
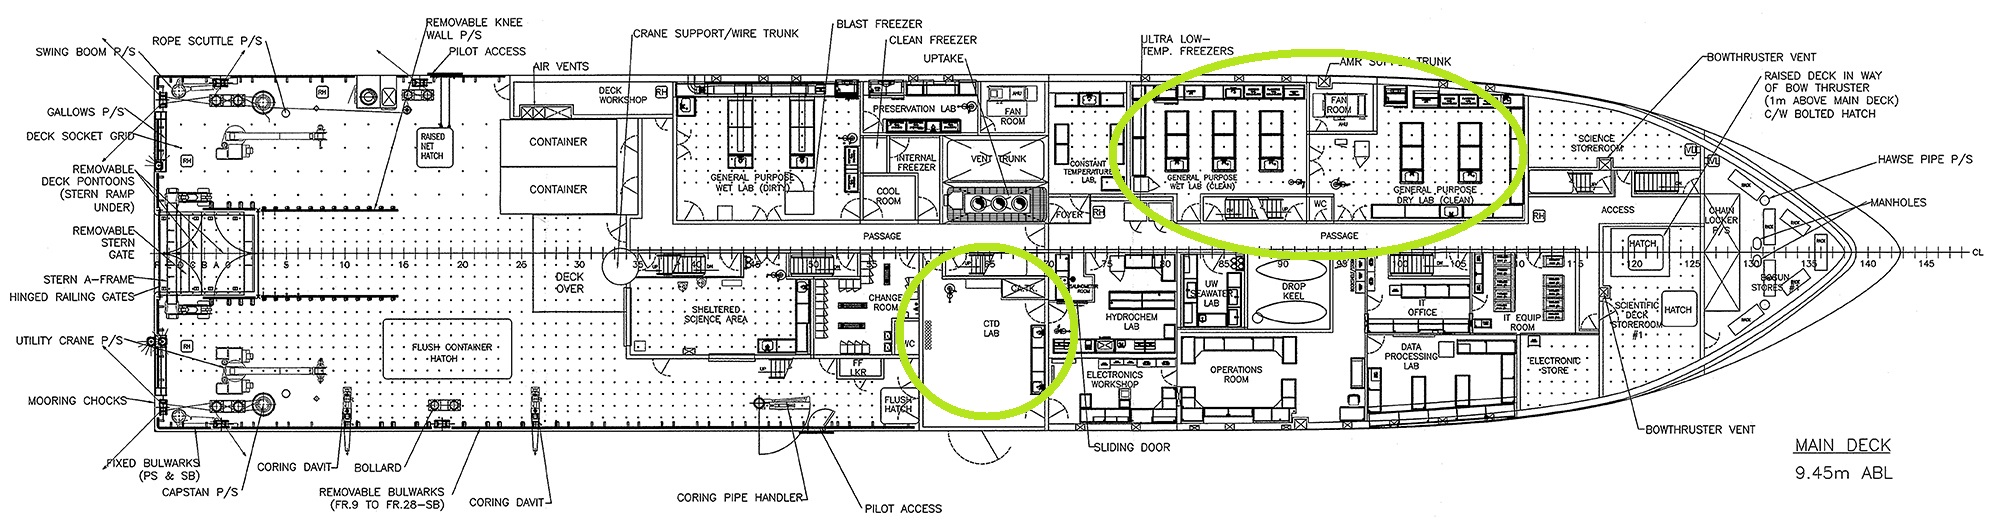
For the purpose of the project, the ship will travel south of Tasmania, to collect water and complete CTD deployments on the GO-SHIP oceanographic transect line SR03. Over the course of the voyage approximately 12 full depth stations will be completed, with the deepest planned deployment to go down to 4500 meters below sea level. Operationally, the ship does not stop, with the capability to undertake 24 hour scientific research.

The proposed stations for the voyage, the station numbers relate to the sames sites completed on voyage IN2018_V01. The southern-most station is at 55 degrees of latitude.
The proposed stations for the voyage are listed below, included is the bottom depth. Latitude and Longitude values are given in decimal formatting. These stations are preliminary selected based on a number of factors, the main factor being historical data. Each of these sites has nutrient measurements spanning 30 years. The visualisation of historical nutrient data at these stations is available to download here.| Station | Count | Longitude | Latitude | Depth |
| 5 | 1 | 146.042 | -44.72 | 3260 |
| 7 | 2 | 145.656 | -45.7 | 2160 |
| 8 | 3 | 145.472 | -46.17 | 2755 |
| 11 | 4 | 144.899 | -47.47 | 4470 |
| 14 | 5 | 144.318 | -48.78 | 4190 |
| 17 | 6 | 143.798 | -49.89 | 3780 |
| 20 | 7 | 143.417 | -50.67 | 3530 |
| 21 | 8 | 143.271 | -51 | 3850 |
| 24 | 9 | 142.84 | -51.81 | 3740 |
| 27 | 10 | 142.39 | -52.66 | 3430 |
| 28 | 11 | 142.14 | -53.12 | 3140 |
| 29 | 12 | 141.862 | -53.57 | 2510 |
| 31 | 13 | 141.329 | -54.52 | 2850 |
| 32 | 14 | 141.021 | -55.02 | 3360 |